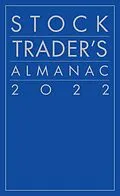
The Most Trusted Almanac Used by Savvy Investors to Profit Year after Year!
Created by Yale Hirsch in 1967, the Stock Trader's Almanac has delivered money-making insights and strategies to investors for more than six decades. The Almanac originated such important market phenomena as the "January Barometer" and the "Santa Claus Rally" and was instrumental in popularizing other tradable strategies, such as "The Best Six Months Strategy" (commonly known as "Sell in May and Go Away") and the four-year Presidential Election Cycle.
Mr. Hirsch imparted his knowledge of the stock market to his son, Jeffrey Hirsch. who joined the organization as a market analyst and historian under the mentorship of his father in 1990 and became editor-in-chief some years later. Even since, Jeff has carried on his father's tradition of constantly improving the Stock Trader's Almanac and has been tireless in his efforts to explain how investors can use the Stock Trader's Almanac to beat the market.
Jeff regularly appears on major news networks such as CNBC, CNN and Bloomberg; he is quoted extensively in major newspapers and financial publications; and he is in high demand as conference speaker. In short, he is the media's "go-to guy" on all things related to applying the lessons of history to today's stock market.
The 2022 Stock Trader's Almanac, the 55th Annual Edition, continues its rich tradition of showing you the cycles, trends, and patterns you need to know in order to trade and/or invest with reduced risk and for maximum profit. Trusted by Barron's, The Wall Street Journal, the New York Times, and many other respected market authorities, this indispensable guide has helped generations of investors. Order your copy to make smarter, more profitable investment decisions in 2022.
Autorentext
JEFFREY HIRSCH is CEO of Hirsch Holdings and Chief Market Strategist at Probabilities Fund Management, LLC. He is the editor-in-chief of the Stock Trader's Almanac and Almanac Investor eNewsletter and a Yahoo Finance contributor. A 30-year Wall Street veteran, Hirsch regularly appears on CNBC, Bloomberg, and Fox Business.
Inhalt
6 Introduction to the Fifty-Fifth Edition
8 2022 Outlook
10 2022 Strategy Calendar
12 January Almanac
14 January's First Five Days: An Early Warning System
16 The Incredible January Barometer (Devised 1972):
Only Eleven Significant Errors in 71 Years
18 January Barometer in Graphic Form Since 1950
20 Down Januarys: A Remarkable Record
22 February Almanac
24 Market Charts of Midterm Election Years
26 Midterm Election Years: Where Bottom Picker's Find Paradise
28 Prosperity More Than Peace Determines the Outcome of Midterm
Congressional Races
30 March Almanac
32 Why a 50% Gain in the Dow is Possible from Its 2022 Low to Its 2023 High
34 The December Low Indicator: A Useful Prognosticating Tool
36 How to Trade Best Months Switching Strategies
38 April Almanac
40 Dow Jones Industrials One-Year Seasonal Pattern Charts Since 1901
42 S&P 500 One-Year Seasonal Pattern Charts Since 1930
44 NASDAQ, Russell 1000 & 2000 One-Year Seasonal Pattern Charts Since 1971
46 May Almanac
48 Summer Market Volume Doldrums Drive Worst Six Months
50 Top Performing Months: Standard & Poor's 500 and Dow Jones Industrials
52 Best Six Months: Still an Eye-Popping Strategy
54 MACD-Timing Triples Best Six Months Results
56 June Almanac
58 Top Performing NASDAQ Months
60 Get More Out of NASDAQ's Best Eight Months with MACD Timing
62 Triple Returns, Fewer Trades: Best 6 + 4-Year Cycle
64 July Almanac
66 First Month of Quarters Is the Most Bullish
68 2020 Daily Dow Point Changes
70 Don't Sell Stocks on Monday or Friday
72 August Almanac
74 A Rally for All Seasons
76 Take Advantage of Down Friday/Down Monday Warning
78 Marty Zweig's Investing Rules
80 Fourth Quarter Market Magic
82 September Almanac
84 Market Gains More on Super-8 Days Each Month
Than on All 13 Remaining Days Combined
86 A Correction for All Seasons
88 First-Trading-Day-of-the-Month Phenomenon
90 October Almanac
92 Sector Seasonality: Selected Percentage Plays
94 Sector Index Seasonality Strategy Calendar
98 Market Behavior Three Days before and Three Days after Holidays
100 November Almanac
102 Midterm Election Time Unusually Bullish
104 Trading the Thanksgiving Market
106 Aura of the Triple Witch4th Quarter Most Bullish:
Down Weeks Trigger More Weakness Week After
108 December Almanac
110 Most of the So-Called January Effect
Takes Place in the Last Half of December
112 January Effect Now Starts in Mid-December
114 Wall Street's Only Free Lunch Served before Christmas
116 If Santa Claus Should Fail to Call, Bears May Come to Broad and Wall
118 2023 Strategy Calendar
DIRECTORY OF TRADING PATTERNS & DATABANK
121 Dow Jones Industrials Market Probability Calendar 2022
122 Recent Dow Jones Industrials Market Probability Calendar 2022
123 S&P 500 Market Probability Calendar 2022
124 Recent S&P 500 Market Probability Calendar 2022
125 NASDAQ Composite Market Probability Calendar 2022
126 Recent NASDAQ Composite Market Probability Calendar 2022
127 Russell 1000 Index Market Probability Calendar 2022
128 Russell 2000 Index Market Probability Calendar 2022
129 Decennial Cycle: A Market Phenomenon
130 Presidential Election/Stock Market Cycle: The 188-Year Saga Continues
131 Dow Jones Industrials Bull and Bear Markets Since 1900
132 Standard & Poor's 500 Bull and Bear Markets Since 1929/
NASDAQ Composite Since 1971<...
